Özet
Copper Clad Steel (CCS) wire has become a leader in bimetallic wires due to its combination of high conductivity from copper and high strength from steel. However, producing high-performance CCS wire requires more than just material stacking. This article provides an in-depth analysis of how three key process parameters—drawing deformation, annealing temperature, and annealing time—directly affect the tensile strength and elongation of CCS wire, offering scientific guidance for production practices.
1. Giriş
In modern communication and power transmission fields, copper clad steel wire applications are becoming increasingly widespread. Its excellent performance stems from the perfect combination of copper and steel—the copper layer provides high conductivity, while the steel core imparts high strength.
However, the final product’s mechanical properties are not simply determined by raw materials but are profoundly influenced by processing technology. Understanding the relationship between these process parameters and performance is crucial for optimizing production and improving product quality.
Related Products: For more information on copper clad steel wire products, visit Copper Clad Steel Wire Product Page.
2. Drawing Process: The “Balancing Act” Between Strength and Ductility
2.1 Core Role of Drawing Deformation
Drawing is the core step in CCS wire production. Research shows that as drawing deformation increases, the mechanical properties of the wire undergo significant changes:
| Performance Indicator | Change Trend | Cause Analysis |
|---|---|---|
| Çekme Dayanımı | Significantly increases | Grain refinement, dislocation density increase |
| Uzama | Continuously decreases | Work hardening, plastic reserve consumption |
This “trade-off” relationship is essentially the classic balance between material strength and ductility.
2.2 Experimental Data: Stress-Strain Curves
The figure below shows stress-strain curves at different drawing deformations (30%-90%):
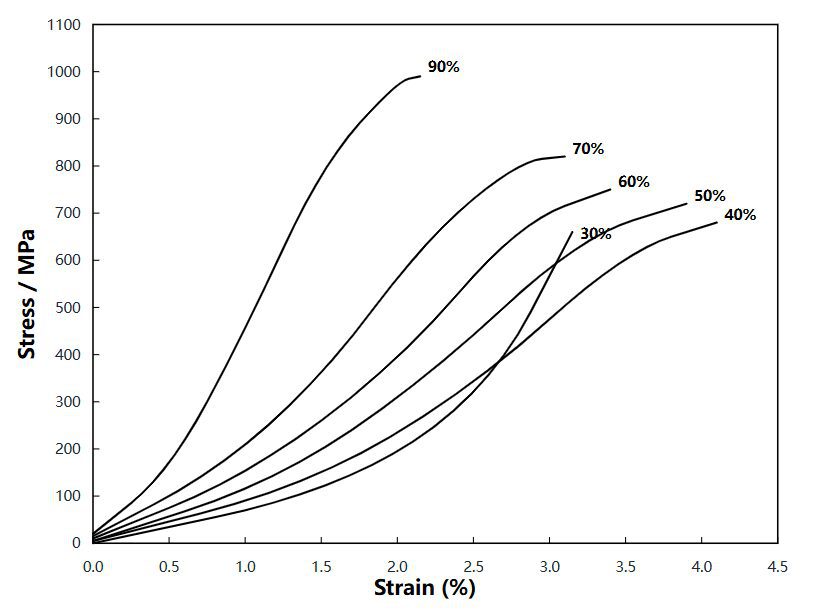
Figure 1: Stress-Strain Curves at Different Drawing Deformations (30%-90%). Y-axis: Stress (MPa), X-axis: Strain (%). The curves show that as deformation increases from 30% to 90%, tensile strength significantly increases from ~600 MPa to ~1000 MPa, while elongation decreases.
Curve Interpretation:
- 30%-40% Deformation: Lower strength (approx. 600-700 MPa), better ductility
- 50%-60% Deformation: Medium strength (approx. 750-800 MPa), balanced comprehensive performance
- 70%-90% Deformation: Significantly improved strength (800-1000 MPa), significantly reduced ductility
Key Finding: At 90% deformation, tensile strength approaches 1000 MPa, but elongation decreases substantially.
2.3 Mixed Rules: A Powerful Tool for Theoretical Prediction
Researchers used the Mixed Rules of composite materials to theoretically calculate tensile strength at different deformation levels:
Mixed Rules Formula:
Formula Explanation:
- σCCSb — Tensile strength of CCS wire
- σCub — Strength of copper
- σFeb — Strength of steel
- VCu — Volume fraction of copper
- VFe — Volume fraction of steel
Verification Results: Experimental data shows that theoretical calculations closely match actual measurements, proving the reliability of this model in predicting CCS wire strength.
Pratik Önem: Manufacturers can estimate finished product strength before drawing, reducing trial-and-error costs.
3. Annealing Treatment: Finding the “Golden Balance Point” of Performance
3.1 Necessity of Annealing
The drawing process generates internal stresses and work hardening, leading to reduced material ductility. The core purposes of annealing treatment are:
- Eliminate internal stresses
- Restore material ductility
- Achieve ideal strength-ductility matching
3.2 Dual Influence of Temperature and Time
Experiments compared annealing effects across different temperature ranges from 550°C to 850°C:
| Annealing Temperature (°C) | Annealing Time (h) | Tensile Strength (MPa) | Elongation (%) |
|---|---|---|---|
| 550 | 0.5 | 518.3 | 14.3 |
| 650 | 2 | 346.7 | 34.3 |
| 850 | 2 | 338.0 | 34.9 |
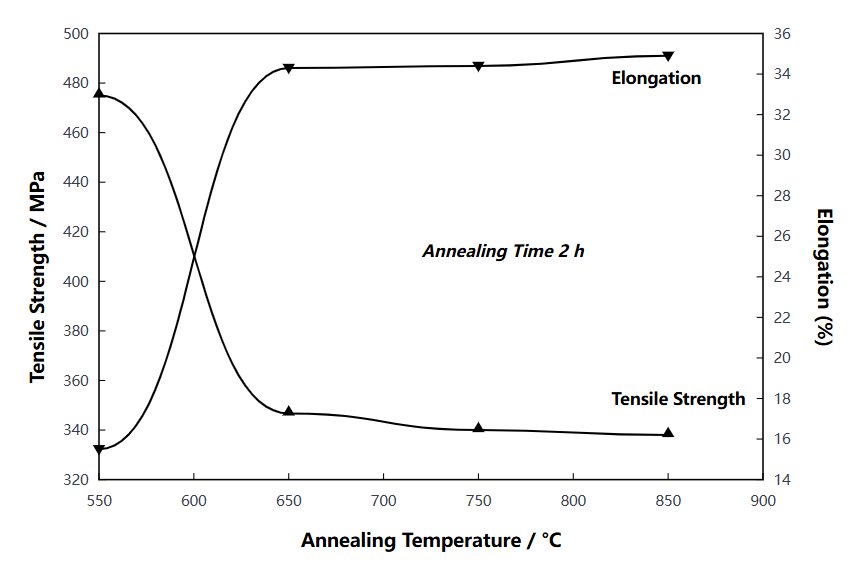
Figure 2: Effect of Annealing Temperature on Çekme Dayanımı ve Uzama (Annealing Time: 2h). Left Y-axis: Tensile Strength (MPa), Right Y-axis: Elongation (%), X-axis: Annealing Temperature (°C). The graph shows that as annealing temperature increases from 550°C to 850°C, tensile strength decreases from ~480 MPa to ~338 MPa, while elongation increases from ~14% to ~35%.
Change Pattern:
- Strength Decrease — As annealing temperature increases and time extends, tensile strength gradually decreases
- Ductility Recovery — Elongation increases accordingly, improving material toughness
3.3 Process Conclusion: 850°C × 2h
Research found that when annealing temperature reaches 850°C and time lasts 2 hours, the tensile strength and elongation of CCS wire tend to stabilize.
Recommended Process Parameters:
- Annealing Temperature: 850°C
- Annealing Time: 2 hours
- Expected Performance: Tensile strength ≈ 338 MPa, Elongation ≈ 35%
This parameter combination can serve as an annealing baseline for pursuing optimal ductility balance.
4. Hardening Index: Validation of Hollomon Relationship
4.1 Quantitative Analysis of Work Hardening Behavior
To quantitatively analyze the work hardening behavior of CCS wire, researchers cited the famous Hollomon Equation:
Hollomon Equation:
Formula Explanation:
- S — True stress
- K — Strength coefficient
- e — True strain
- n — Strain hardening exponent
4.2 Experimental Results: n = 0.4
Regression analysis of wire with 50% drawing deformation yielded:
Strain Hardening Exponent n = 0.4
Technical Significance:
- Higher n value indicates good uniform deformation capability
- Effectively delays necking occurrence
- Beneficial for subsequent processing and forming
5. Microscopic Mechanism: The Essence of Grain Evolution
Changes in mechanical properties are essentially the result of microstructural evolution:
As-Drawn State:
- Grains are elongated and refined
- Dislocation density increases significantly
- Strength increases, ductility decreases
Annealed State:
- α-Fe phase grains grow significantly
- From initial few micrometers to hundreds of micrometers
- Internal stresses eliminated, ductility restored
Micro-Macro Correlation: Changes in grain size directly determine macroscopic mechanical performance.
6. Production Practice Guidance
6.1 Precise Prediction
Through mixed rules, manufacturers can estimate finished product strength before drawing:
- Back-calculate required deformation based on target strength
- Optimize copper/steel volume fraction ratio
- Reduce trial runs and lower R&D costs
6.2 Process Optimization
For pursuing optimal ductility balance, 850°C × 2h is a worthwhile annealing baseline:
- Suitable for application scenarios with high elongation requirements
- If higher strength is needed, appropriately reduce annealing temperature or shorten time
6.3 Quality Control
It is recommended to monitor the following key parameters during production:
- Drawing deformation (real-time monitoring)
- Annealing temperature curve (ensure uniformity)
- Annealing time (precise control)
- Mechanical property sampling (tensile strength, elongation)
7. FISSOT Process Advantages
As a professional supplier of copper clad steel materials, GENERAL CLAD has significant advantages in processing technology control:
- Precision Drawing Control — Advanced drawing equipment with deformation control accuracy of ±1%
- Annealing Process Optimization — Exclusive process database based on extensive experimental data
- Customizable Performance — Adjust process parameters according to customer requirements for precise performance matching
- Full-Process Quality Traceability — Every process step is traceable from raw materials to finished products
- Technical Support Services — Provides process consultation, performance optimization, and application guidance
Product Link: Copper Clad Steel Wire Product Details
8. Conclusion
The mechanical properties of copper clad steel wire are not formed by chance but are the result of combined effects from drawing, annealing, and other processing technologies. Understanding the scientific relationship between these process parameters and performance is significant for:
- Manufacturers — Optimize processes, improve yield rates, reduce costs
- Application Customers — Reasonable selection, ensure performance, extend service life
- Industry Progress — Promote standard improvement, foster technological innovation
In the future, with continuous advancements in process technology and microstructural characterization methods, the performance boundaries of copper clad steel wire will continue to expand, providing higher-quality material solutions for communications, power, automotive, and other fields.